Magic grid argument
![]()

using Plots
plotlyjs()
The grid lines can be modified individually for each axis with the magic grid argument.
x = rand(10)
p1 = plot(x, title = "Default looks")
p2 = plot(x, grid = (:y, :olivedrab, :dot, 1, 0.9), title = "Modified y grid")
p3 = plot(deepcopy(p2), title = "Add x grid")
xgrid!(p3, :on, :cadetblue, 2, :dashdot, 0.4)
plot(p1, p2, p3, layout = (1, 3), label = "", fillrange = 0, fillalpha = 0.3)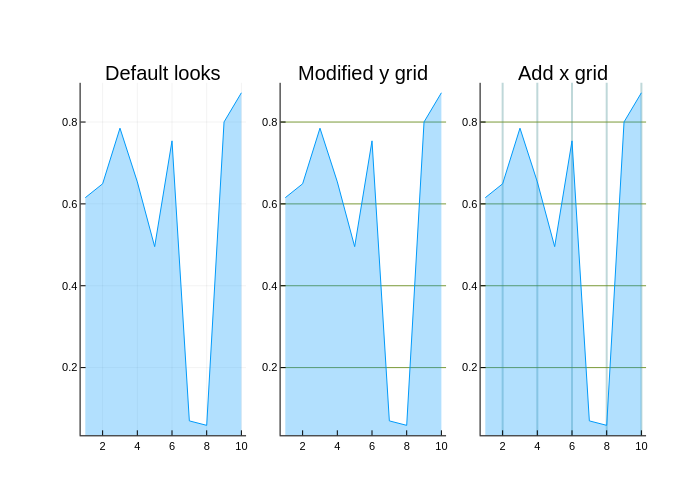
This page was generated using DemoCards.jl and Literate.jl.