Lines and markers with varying colors
![]()

using Plots
plotlyjs()
You can use the line_z and marker_z properties to associate a color with each line segment or marker in the plot.
t = range(0, stop = 1, length = 100)
θ = (6π) .* t
x = t .* cos.(θ)
y = t .* sin.(θ)
p1 = plot(x, y, line_z = t, linewidth = 3, legend = false)
p2 = scatter(x, y, marker_z = (+), color = :bluesreds, legend = false)
plot(p1, p2)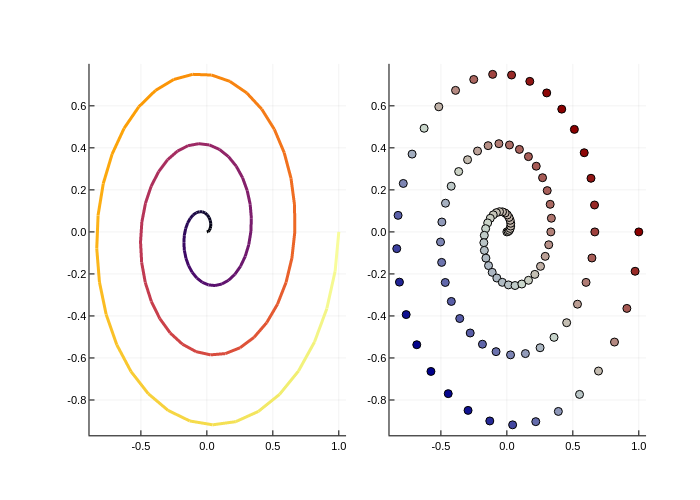
This page was generated using DemoCards.jl and Literate.jl.