Stacked area chart
![]()

using Plots
plotlyjs()
areaplot draws stacked area plots.
areaplot(1:3, [1 2 3; 7 8 9; 4 5 6], seriescolor = [:red :green :blue], fillalpha = [0.2 0.3 0.4])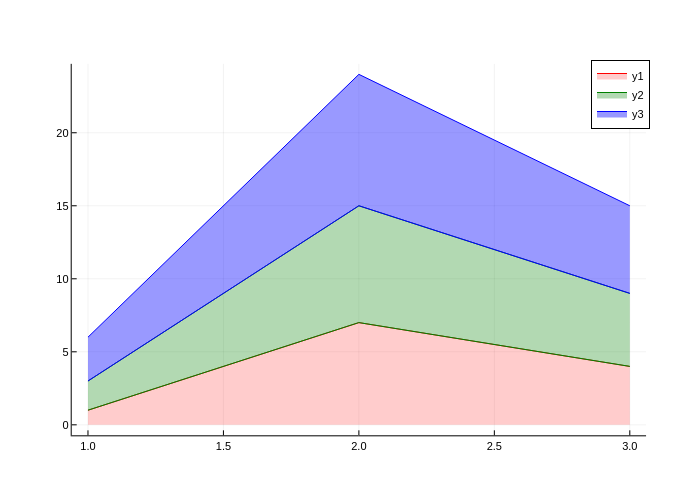
This page was generated using DemoCards.jl and Literate.jl.
![]()
using Plots
plotlyjs()
areaplot draws stacked area plots.
areaplot(1:3, [1 2 3; 7 8 9; 4 5 6], seriescolor = [:red :green :blue], fillalpha = [0.2 0.3 0.4])
This page was generated using DemoCards.jl and Literate.jl.
Settings
This document was generated with Documenter.jl version 1.17.0 on Friday 5 June 2026. Using Julia version 1.12.6.