Examples
Undirected graph
Plot an undirected graph with labeled nodes and individual node sizes/colors.
using GraphRecipes
using Plots

const n = 15
const A = Float64[ rand() < 0.5 ? 0 : rand() for i=1:n, j=1:n]
for i=1:n
    A[i, 1:i-1] = A[1:i-1, i]
    A[i, i] = 0
end

graphplot(A,
          markersize = 0.2,
          node_weights = 1:n,
          markercolor = range(colorant"yellow", stop=colorant"red", length=n),
          names = 1:n,
          fontsize = 10,
          linecolor = :darkgrey
          )
Now plot the graph in three dimensions.
graphplot(A,
           node_weights = 1:n,
           markercolor = :darkgray,
           dim = 3,
           markersize = 5,
           linecolor = :darkgrey,
           linealpha = 0.5
       )
Graphs.jl
You can visualize a Graphs.AbstractGraph by passing it to graphplot.
using GraphRecipes, Plots
using Graphs

g = wheel_graph(10)
graphplot(g, curves=false)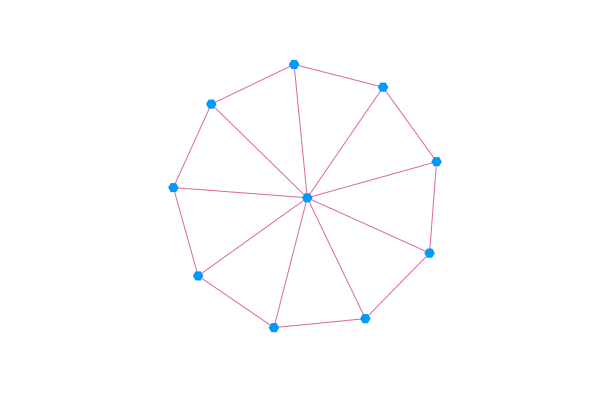
Directed Graphs
If you pass graphplot a Graphs.DiGraph or an asymmetric adjacency matrix, then graphplot will use arrows to indicate the direction of the edges. Note that using the arrow attribute with the pythonplot backend will allow you to control the aesthetics of the arrows.
using GraphRecipes, Plots
g = [0 1 1;
     0 0 1;
     0 1 0]

graphplot(g, names=1:3, curvature_scalar=0.1)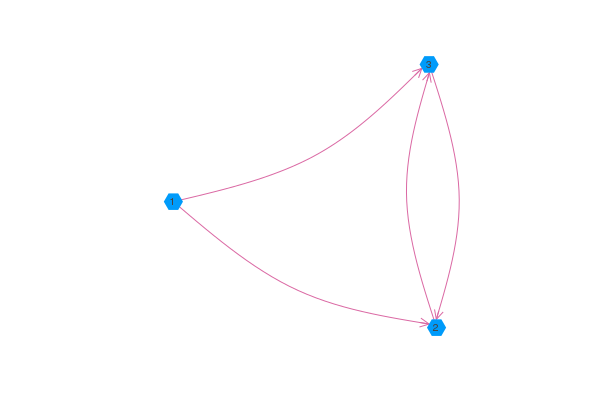
Edge Labels
Edge labels can be passed via the edgelabel keyword argument. You can pass edge labels as a dictionary of (si::Int, di::Int) => label, where si, di are the indices of the source and destiny nodes for the edge being labeled. Alternatively, you can pass a matrix or a vector of labels. graphplot will try to convert any label you pass it into a string unless you pass one of missing, NaN, nothing, false or "", in which case, graphplot will skip the label.
using GraphRecipes, Plots
using Graphs

const n = 8
g = wheel_digraph(n)
edgelabel_dict = Dict()
edgelabel_mat = Array{String}(undef, n, n)
for i in 1:n
    for j in 1:n
        edgelabel_mat[i, j] = edgelabel_dict[(i, j)] = string("edge ", i, " to ", j)
    end
end
edgelabel_vec = edgelabel_mat[:]

graphplot(g, names=1:n, edgelabel=edgelabel_dict, curves=false, nodeshape=:rect)  # Or edgelabel=edgelabel_mat, or edgelabel=edgelabel_vec.
Self edges
using Graphs, Plots, GraphRecipes

g = [1 1 1;
     0 0 1;
     0 0 1]

graphplot(DiGraph(g), self_edge_size=0.2)
Multigraphs
using Graphs, Plots, GraphRecipes
graphplot([[1,1,2,2],[1,1,1],[1]], names="node_".*string.(1:3), nodeshape=:circle, self_edge_size=0.25)
Arc and chord diagrams
using LinearAlgebra
using SparseArrays
using GraphRecipes
using Plots

adjmat = Symmetric(sparse(rand(0:1,8,8)))

plot(
    graphplot(adjmat,
              method=:chorddiagram,
              names=[text(string(i), 8) for i in 1:8],
              linecolor=:black,
              fillcolor=:lightgray),

    graphplot(adjmat,
              method=:arcdiagram,
              markersize=0.5,
              linecolor=:black,
              markercolor=:black)
    )
Julia code – AST
using GraphRecipes
using Plots
default(size=(1000, 1000))

code = :(
function mysum(list)
    out = 0
    for value in list
        out += value
    end
    out
end
)

plot(code, fontsize=12, shorten=0.01, axis_buffer=0.15, nodeshape=:rect)
Julia Type Trees
using GraphRecipes
using Plots
default(size=(1000, 1000))

plot(AbstractFloat, method=:tree, fontsize=10, nodeshape=:ellipse)
AbstractTrees Trees
using AbstractTrees

AbstractTrees.children(d::Dict) = [p for p in d]
AbstractTrees.children(p::Pair) = AbstractTrees.children(p[2])
function AbstractTrees.printnode(io::IO, p::Pair)
    str = isempty(AbstractTrees.children(p[2])) ? string(p[1], ": ", p[2]) : string(p[1], ": ")
    print(io, str)
end

d = Dict(:a => 2,:d => Dict(:b => 4,:c => "Hello"),:e => 5.0)

using GraphRecipes
using Plots
default(size=(1000, 1000))

plot(TreePlot(d), method=:tree, fontsize=10, nodeshape=:ellipse)