PythonPlot
To switch to the PythonPlot backend, you can use:
using Plots
pythonplot()
The demos are generated from Plots._examples. Empty demos are features that this backend does not support.
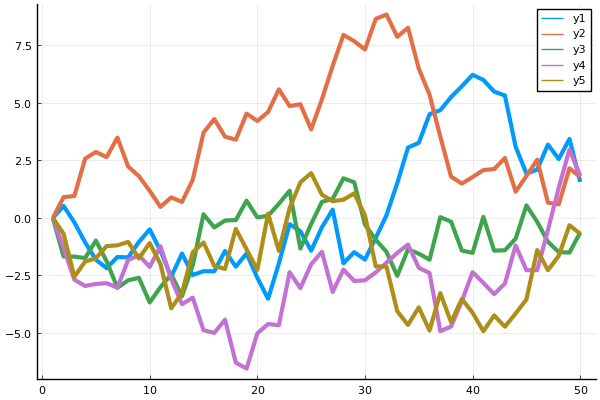
Lines
Functions, adding data, and animations
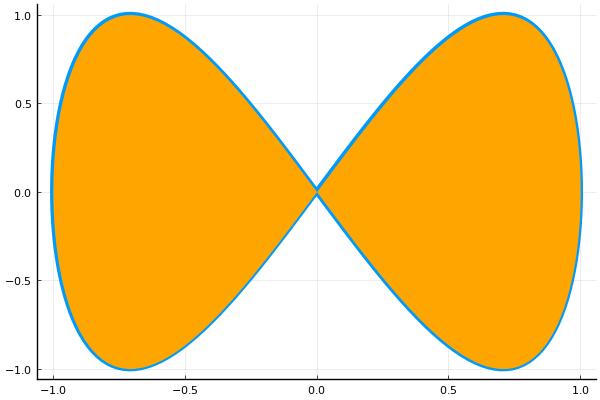
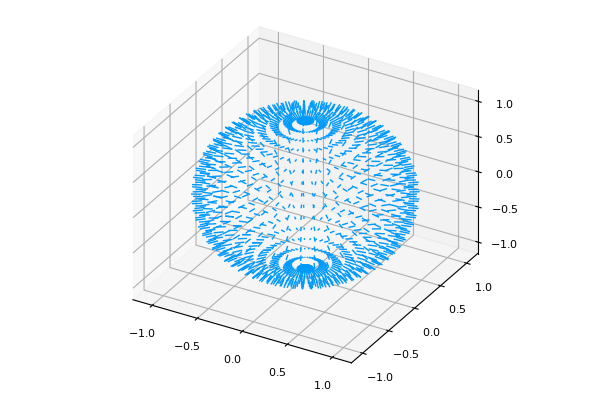
Parametric plots
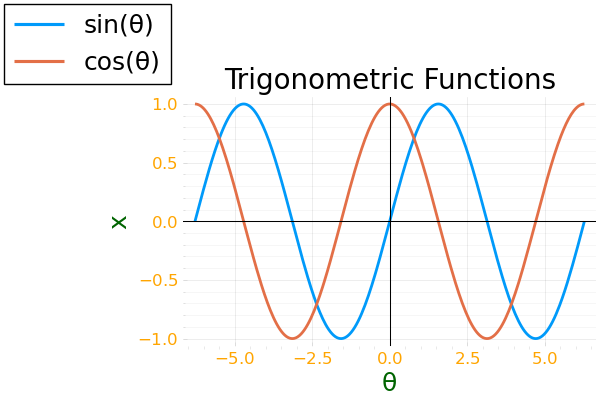
Colors
Global
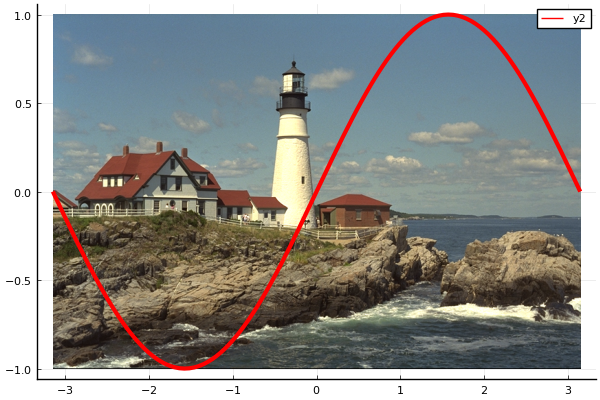
Images
Arguments
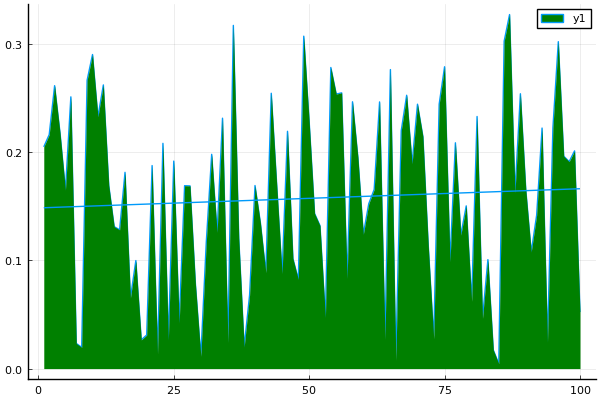
Build plot in pieces
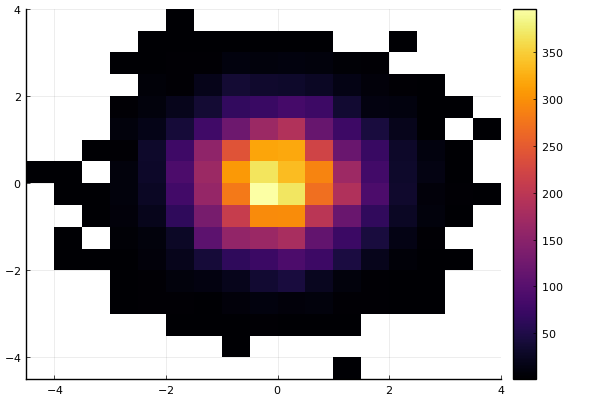
Histogram2D
Line types
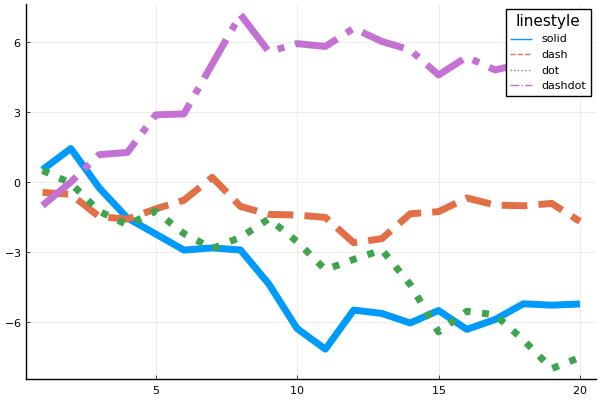
Line styles
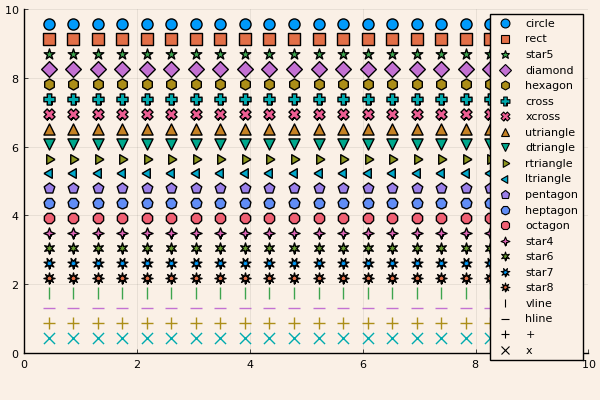
Marker types
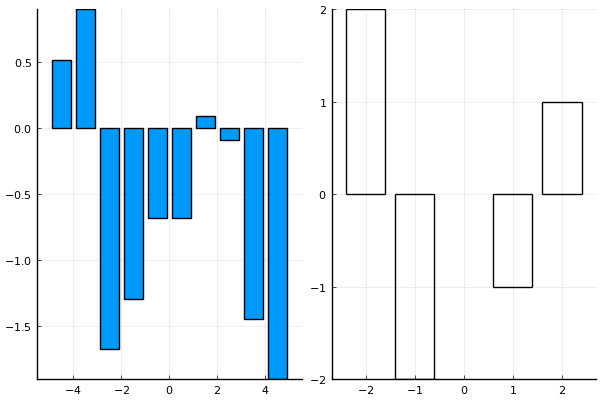
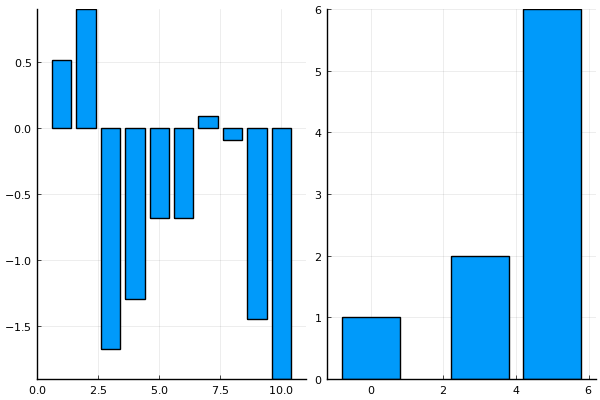
Bar
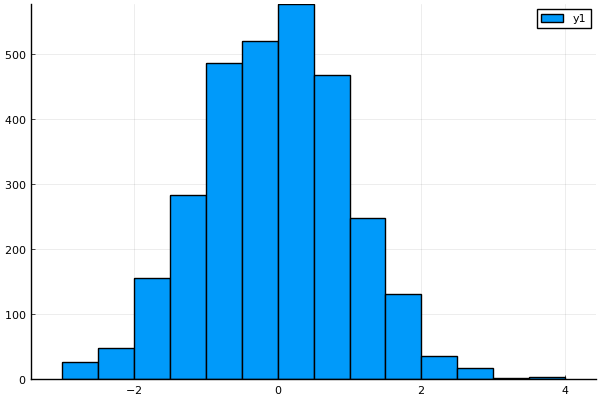
Histogram
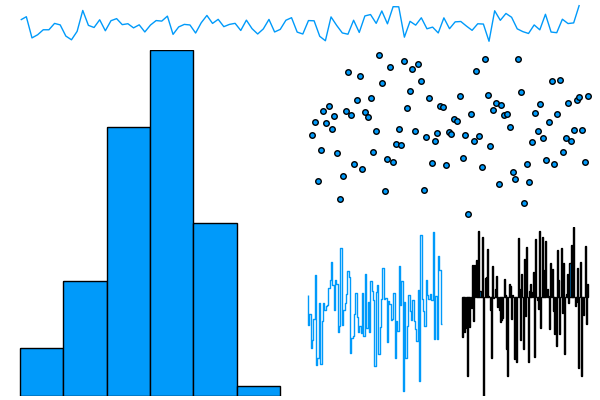
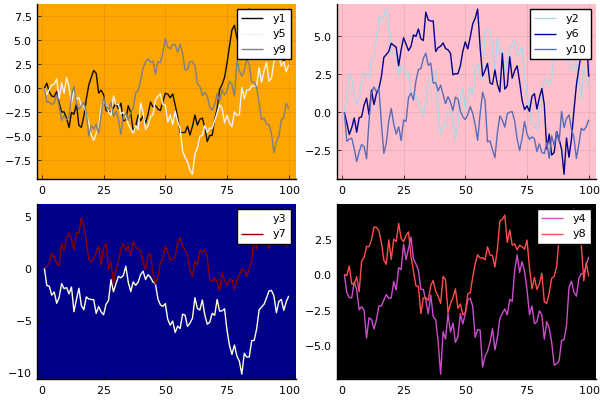
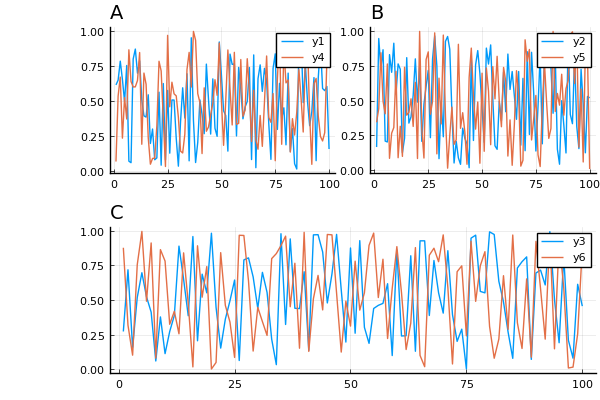
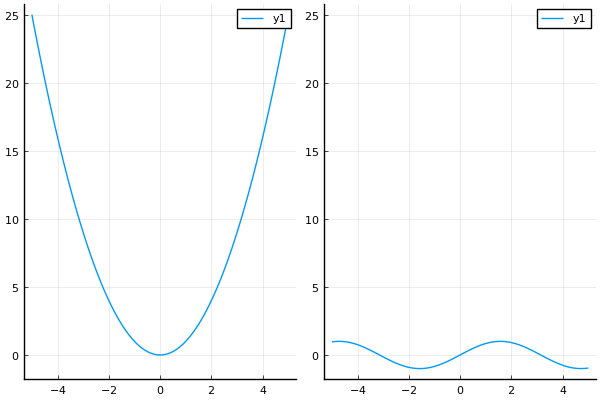
Subplots
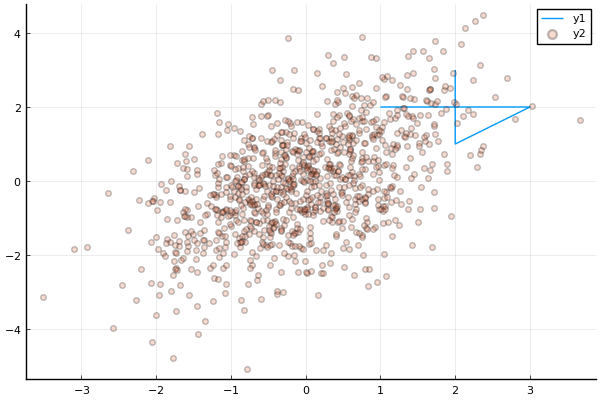
Adding to subplots
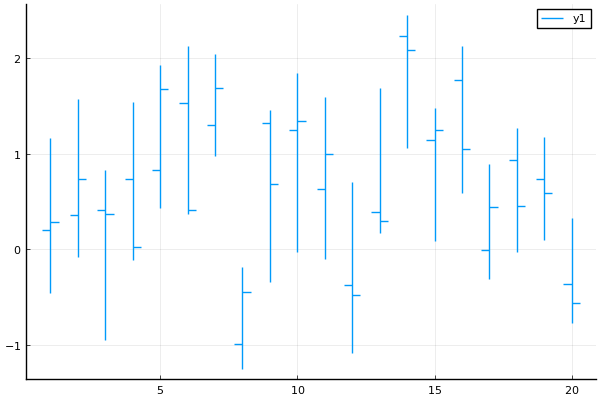
Open/High/Low/Close
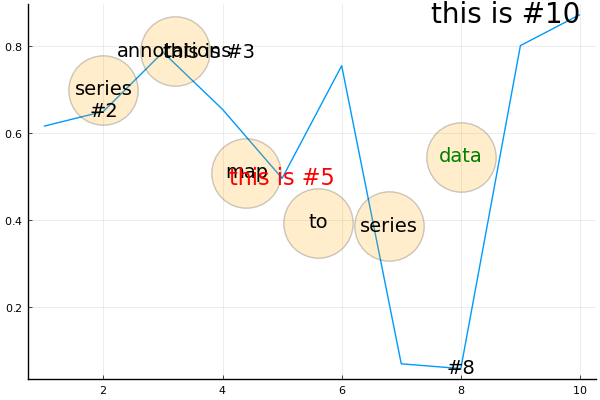
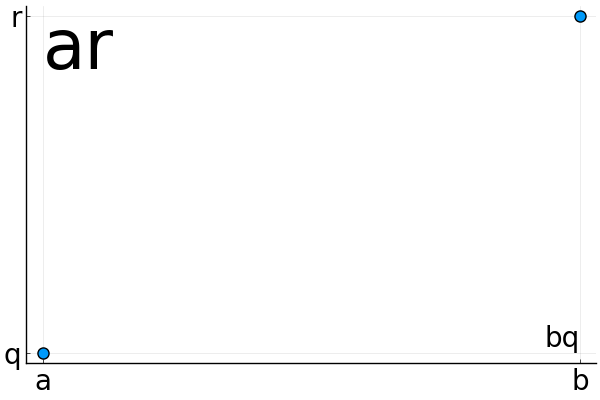
Annotations
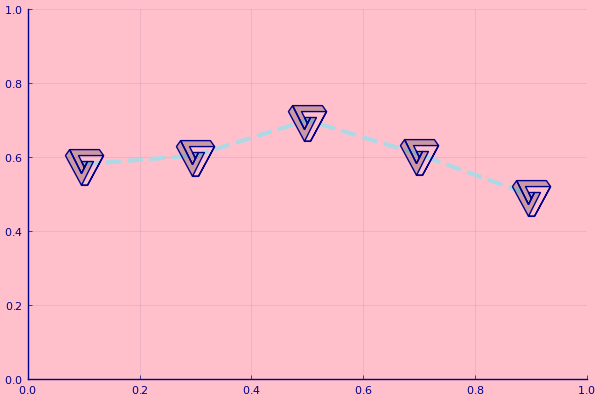
Custom Markers
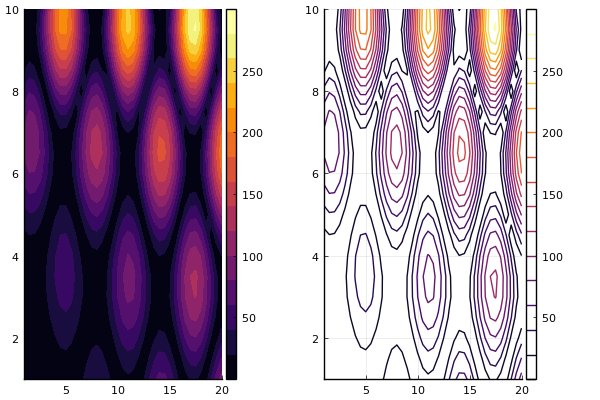
Contours
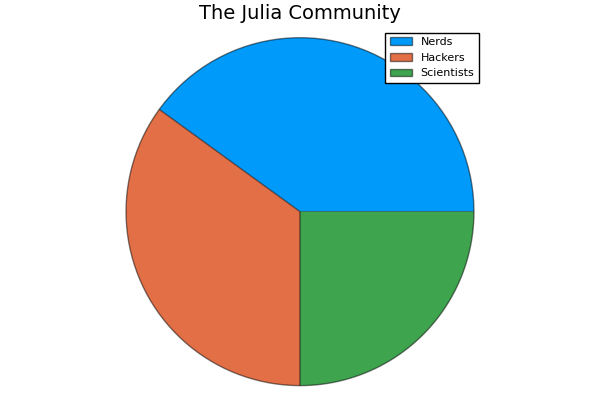
Pie
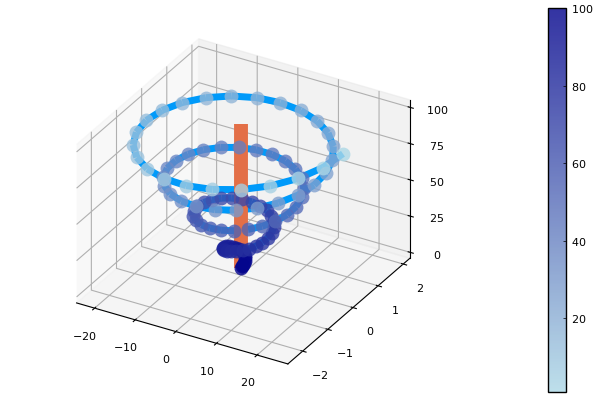
3D
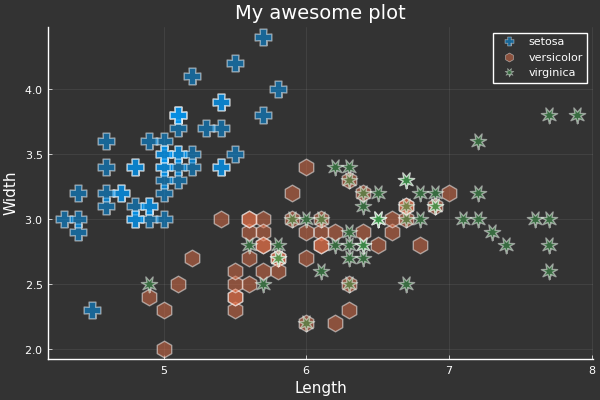
DataFrames
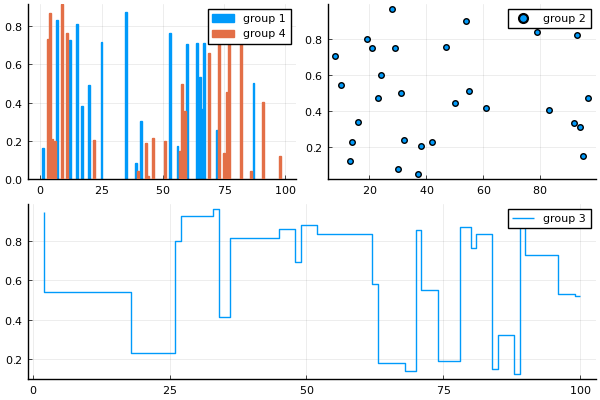
Groups and Subplots
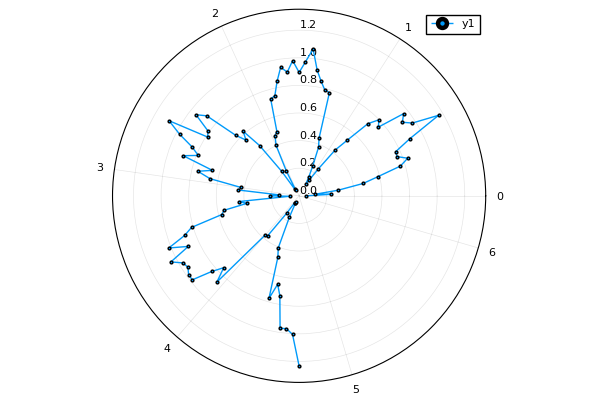
Polar Plots
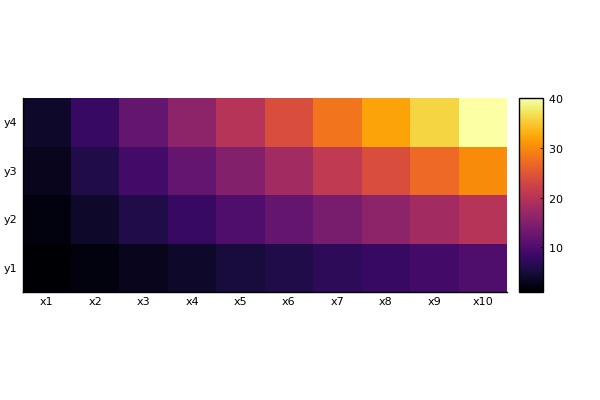
Heatmap, categorical axes, and aspect_ratio
Layouts, margins, label rotation, title location
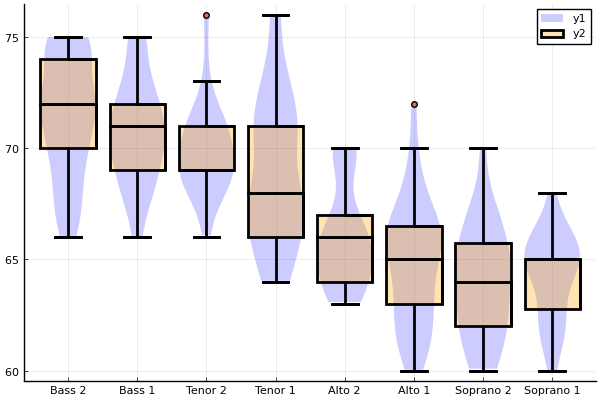
Boxplot and Violin series recipes
Animation with subplots
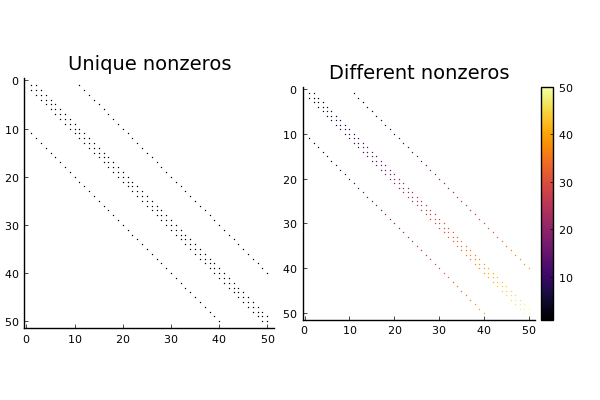
Spy
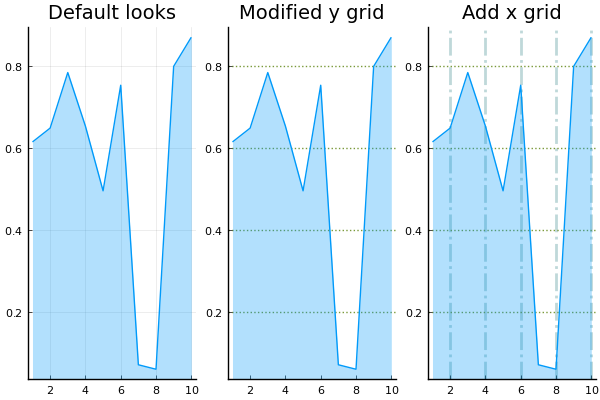
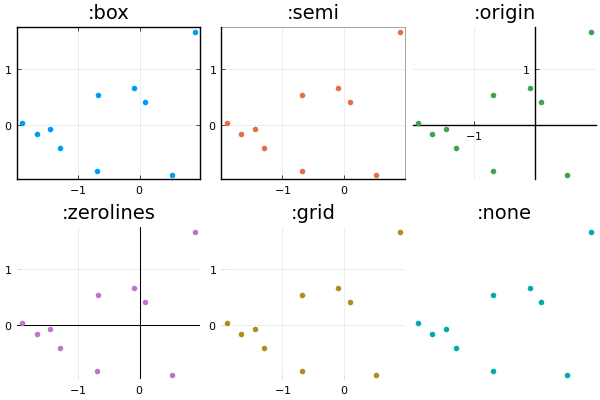
Magic grid argument
Framestyle
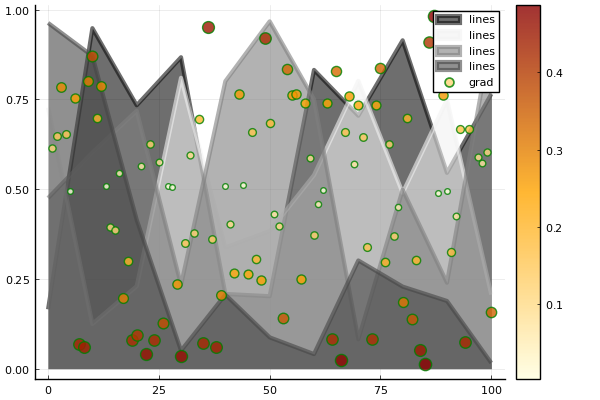
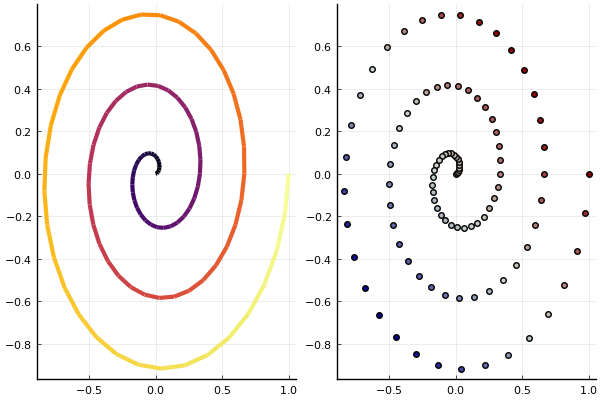
Lines and markers with varying colors
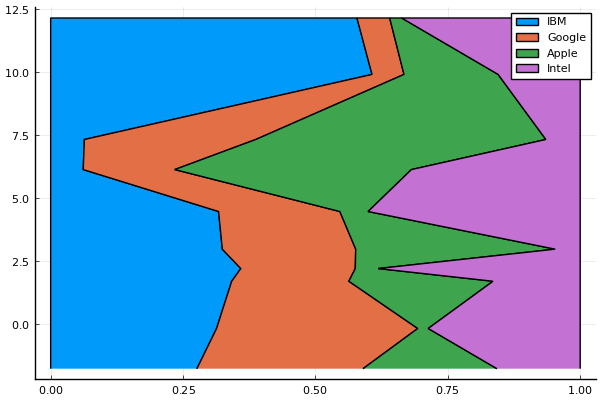
Portfolio Composition maps
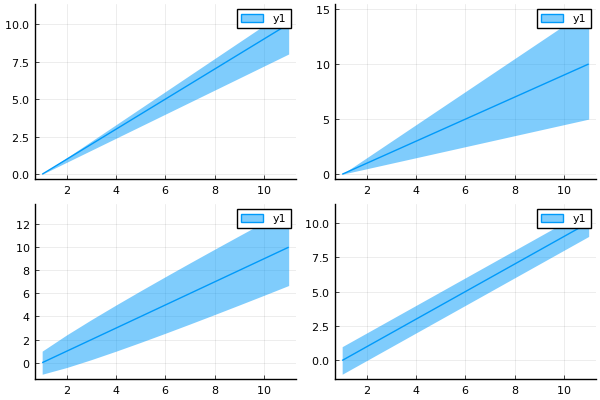
Ribbons
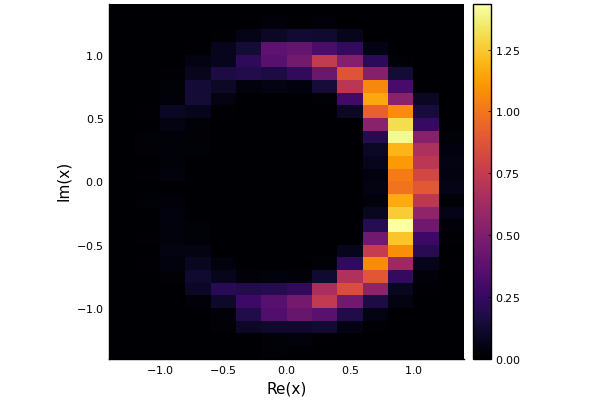
Histogram2D (complex values)
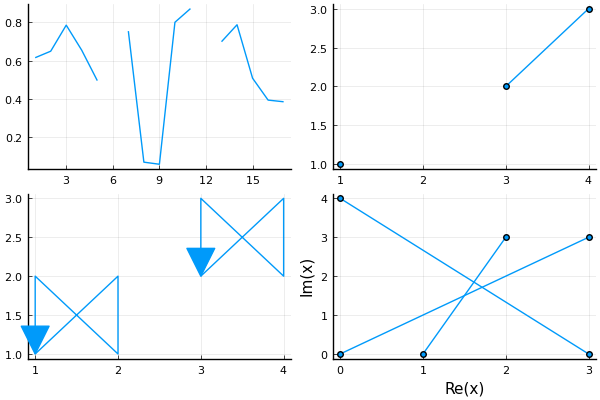
Unconnected lines using `missing` or `NaN`
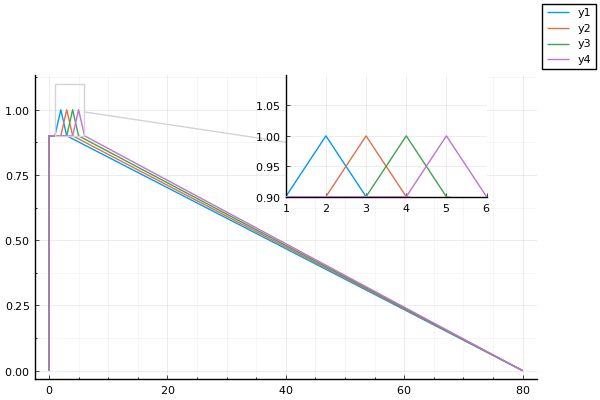
Lens
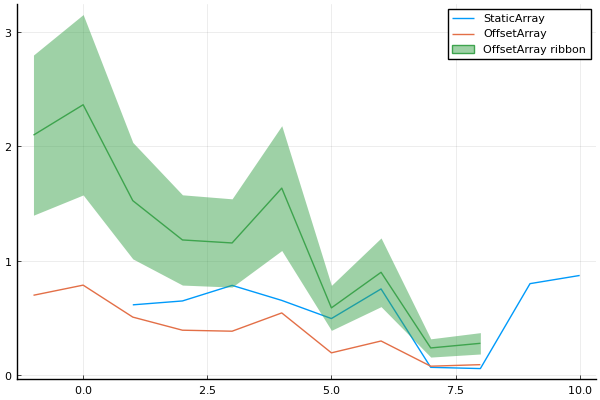
Array Types
Setting defaults and font arguments
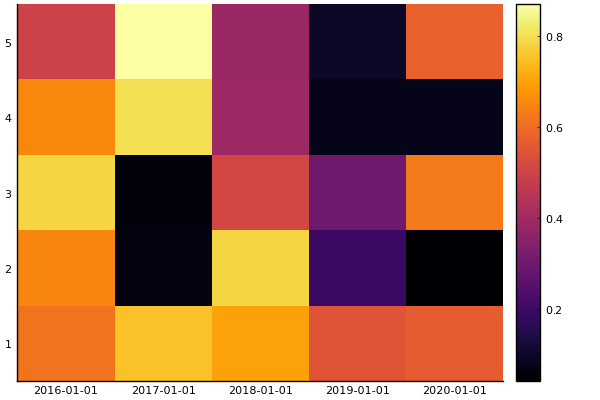
Heatmap with DateTime axis
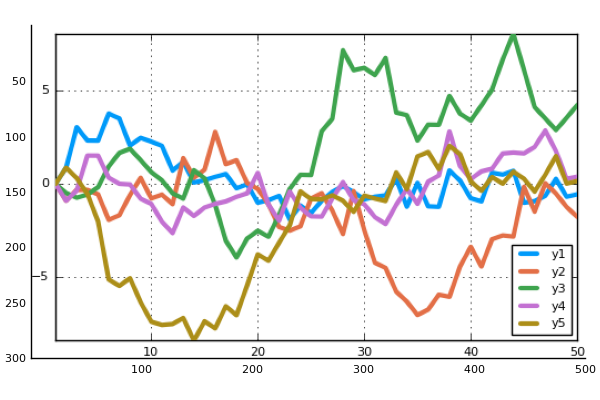
Linked axes
Error bars and array type recipes

Tuples and `Point`s as data
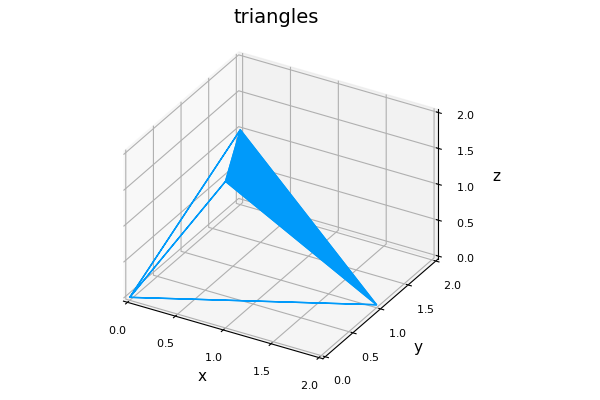
Mesh3d
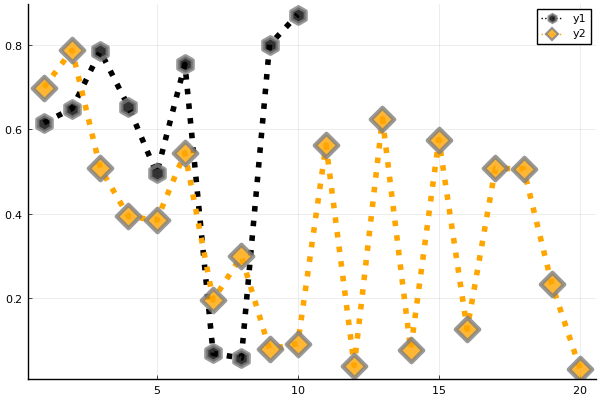
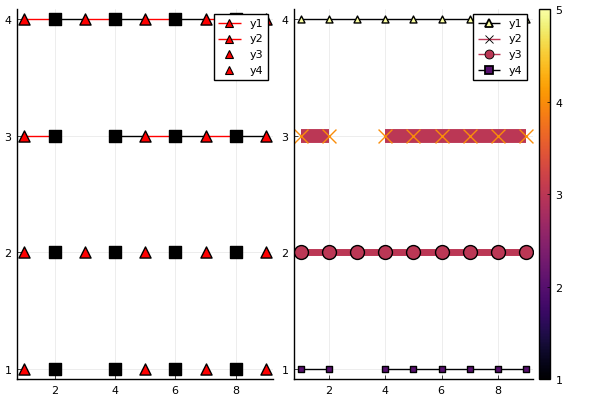
Vectors of markershapes and segments
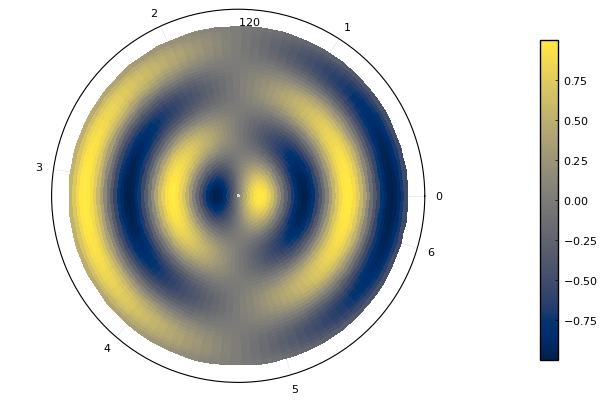
Polar heatmaps
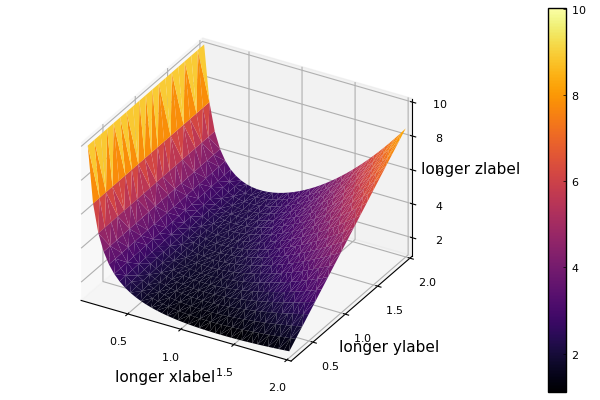
3D surface with axis guides
Images with custom axes
3d quiver
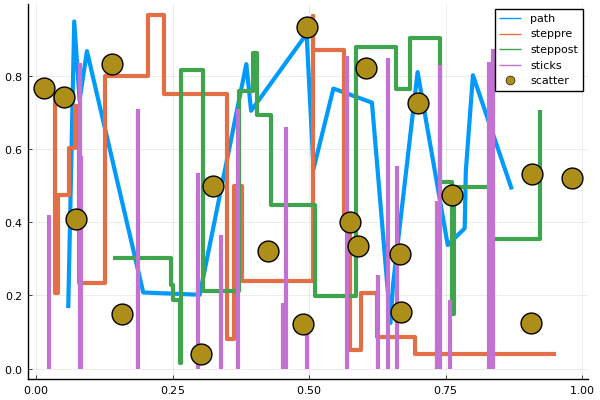
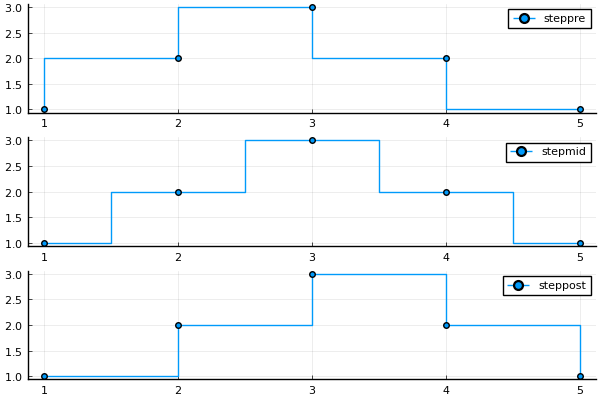
Step Types
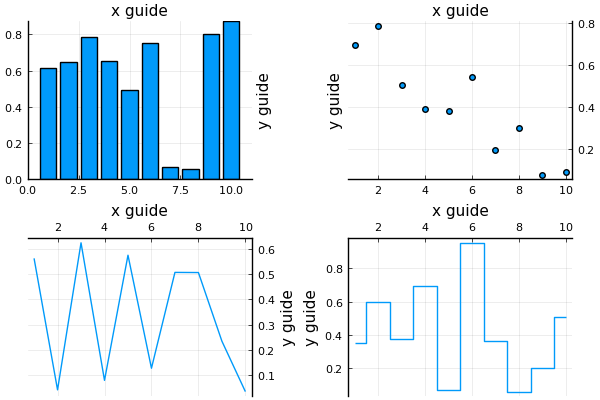
Guide positions and alignment
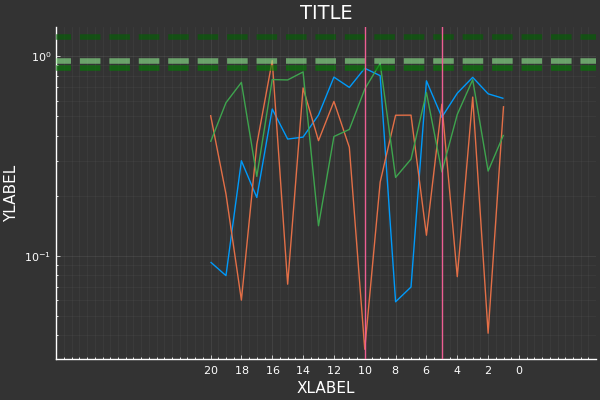
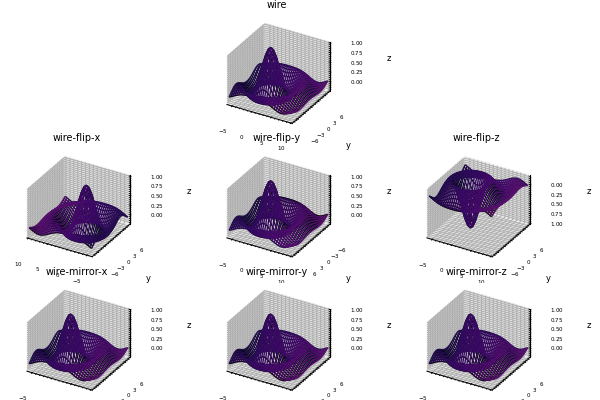
3D axis flip / mirror
Bar plot customizations
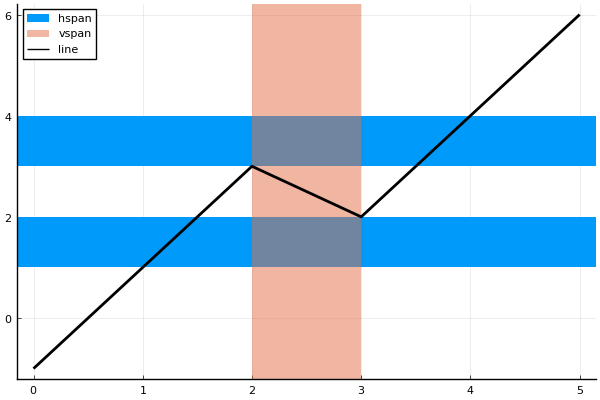
Vertical and horizontal spans
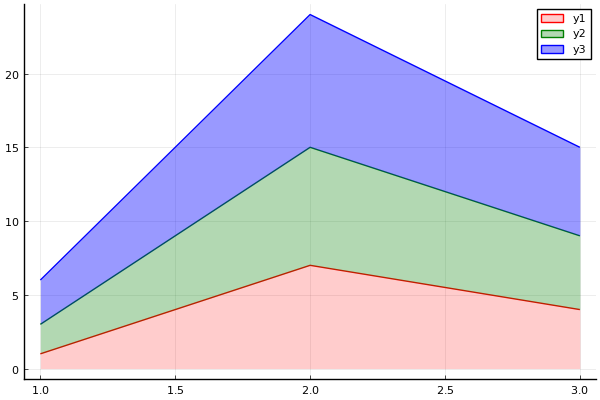
Stacked area chart
Annotations at discrete locations
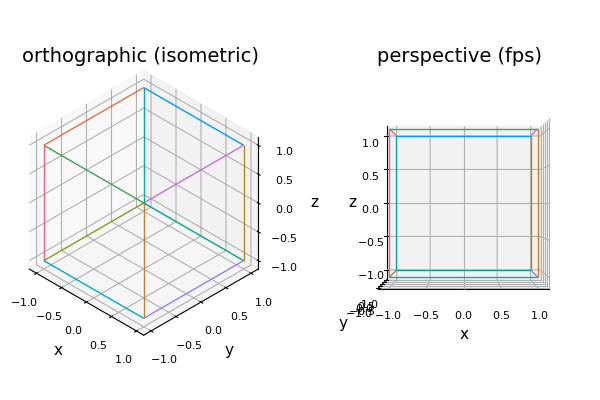
3D projection
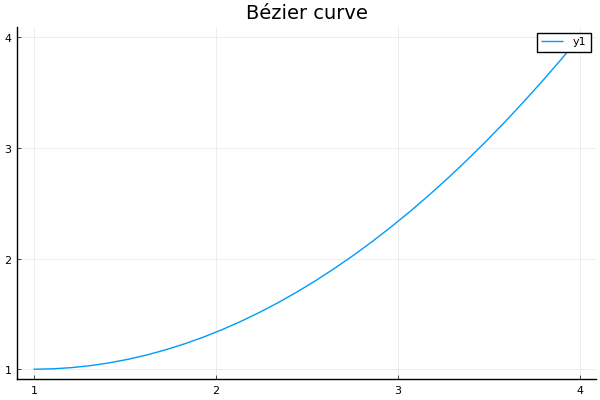
Bézier curve
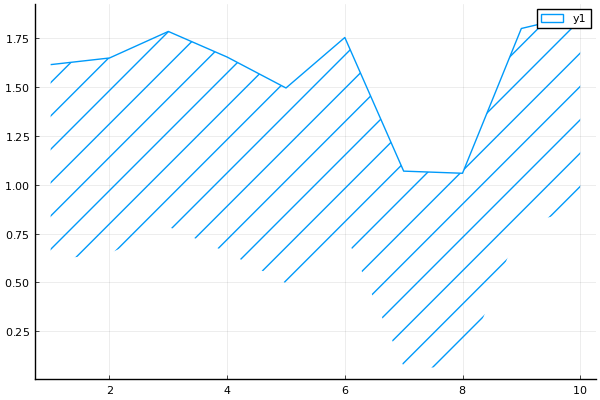
Filled area - hatched patterns
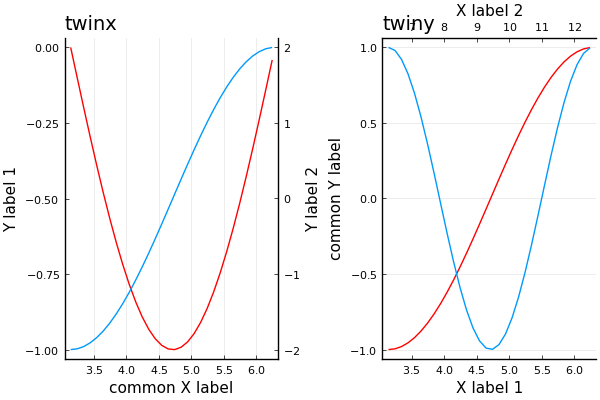
Shared axes (twin)
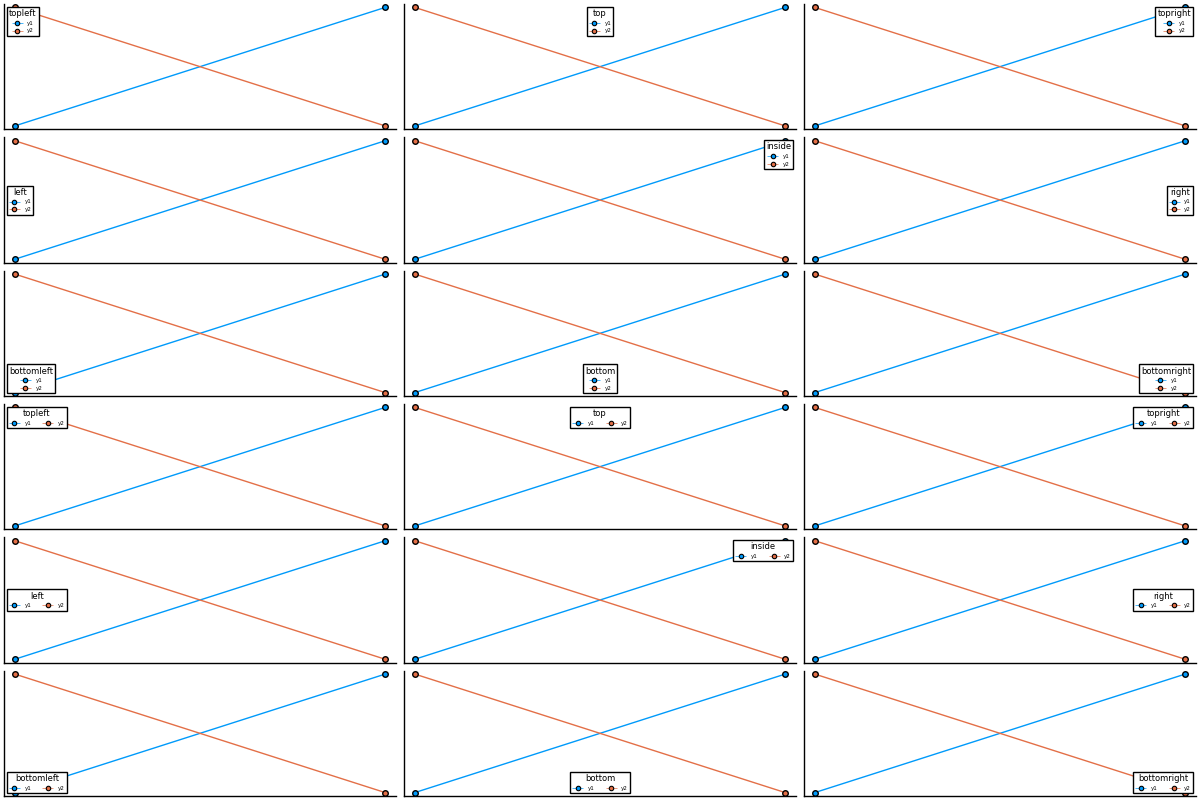
Legend positions
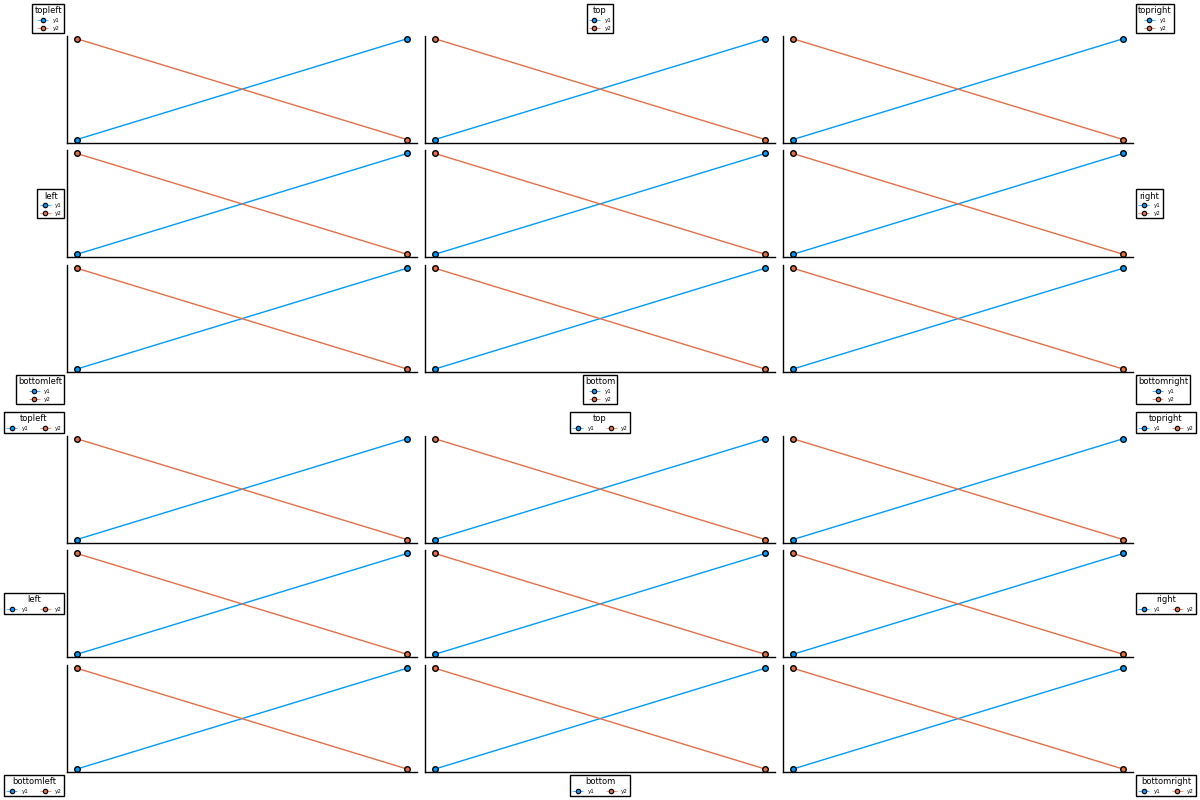
Outer legend positions
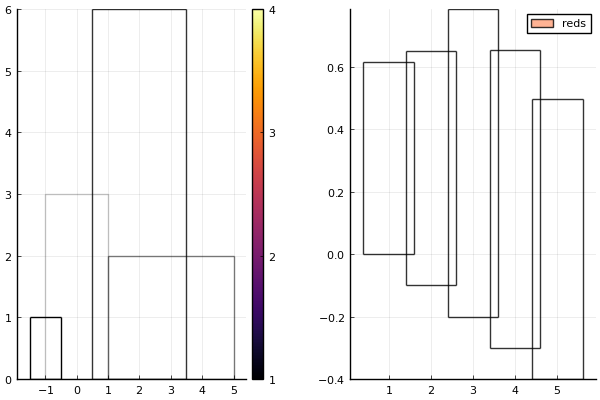
Specifying edges and missing values for barplots