Animations
Animations are created in 3 steps:
- Initialize an
Animationobject. - Save each frame of the animation with
frame(anim). - Convert the frames to an animated gif with
gif(anim, filename, fps=15)
The convenience macros @gif and @animate simplify this code immensely. See the home page for examples of the short version, or the gr example for the long version.
Convenience macros
There are two macros for varying levels of convenience in creating animations: @animate and @gif. The main difference is that @animate will return an Animation object for later processing, and @gif will create an animated gif file (and display it when returned to an IJulia cell).
Use @gif for simple, one-off animations that you want to view immediately. Use @animate for anything more complex. Constructing Animation objects can be done when you need full control of the life-cycle of the animation (usually unnecessary though).
Examples:
using Plots

@userplot CirclePlot
@recipe function f(cp::CirclePlot)
    x, y, i = cp.args
    n = length(x)
    inds = circshift(1:n, 1 - i)
    linewidth --> range(0, 10, length = n)
    seriesalpha --> range(0, 1, length = n)
    aspect_ratio --> 1
    label --> false
    x[inds], y[inds]
end

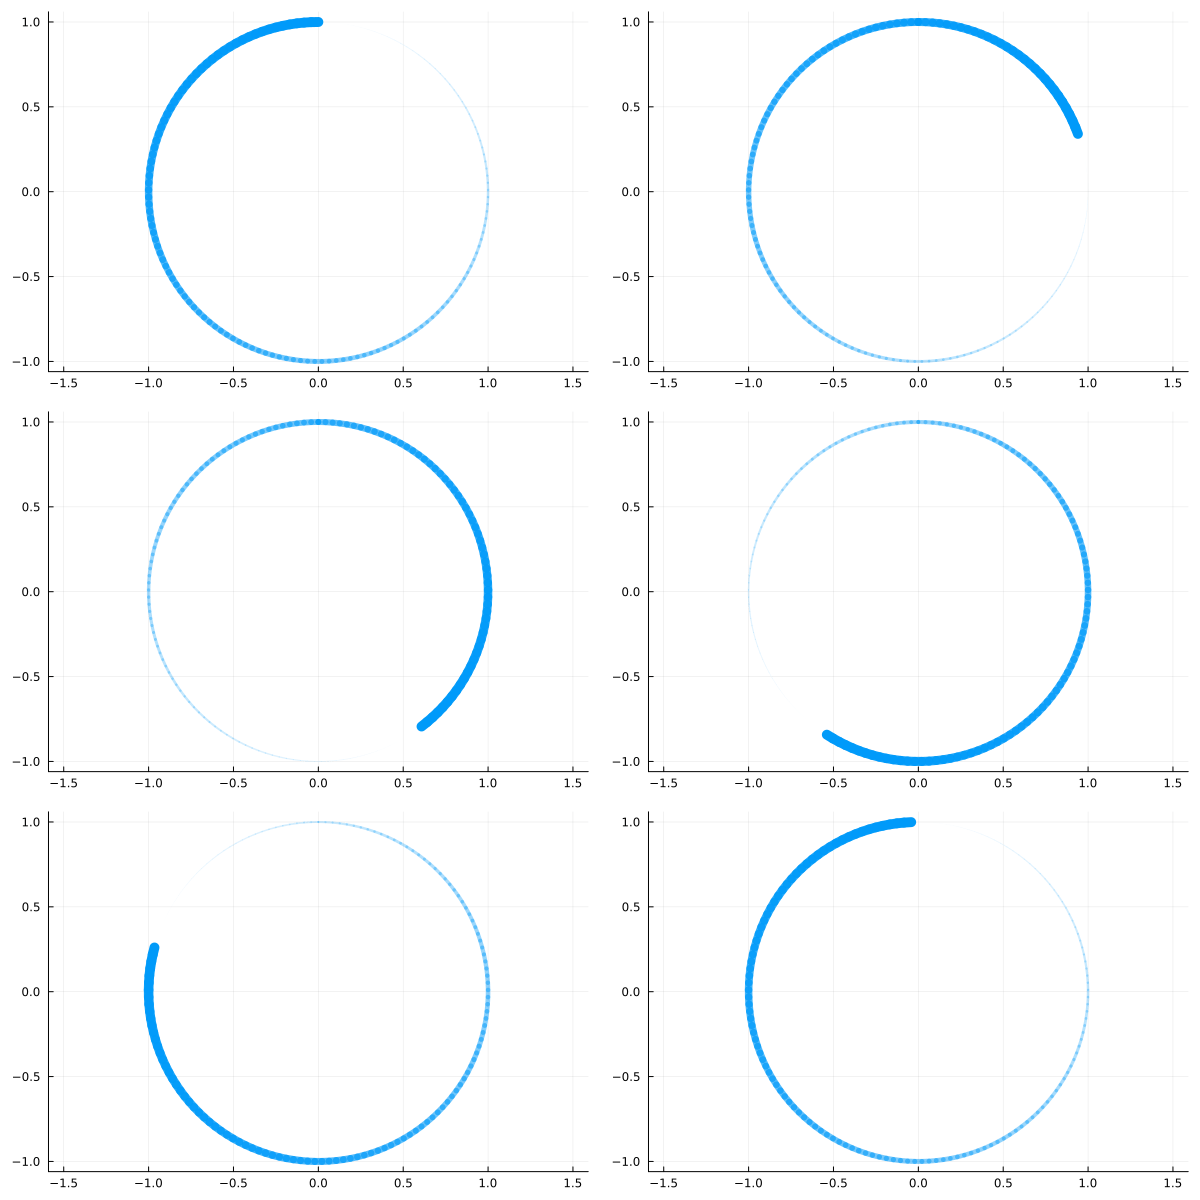
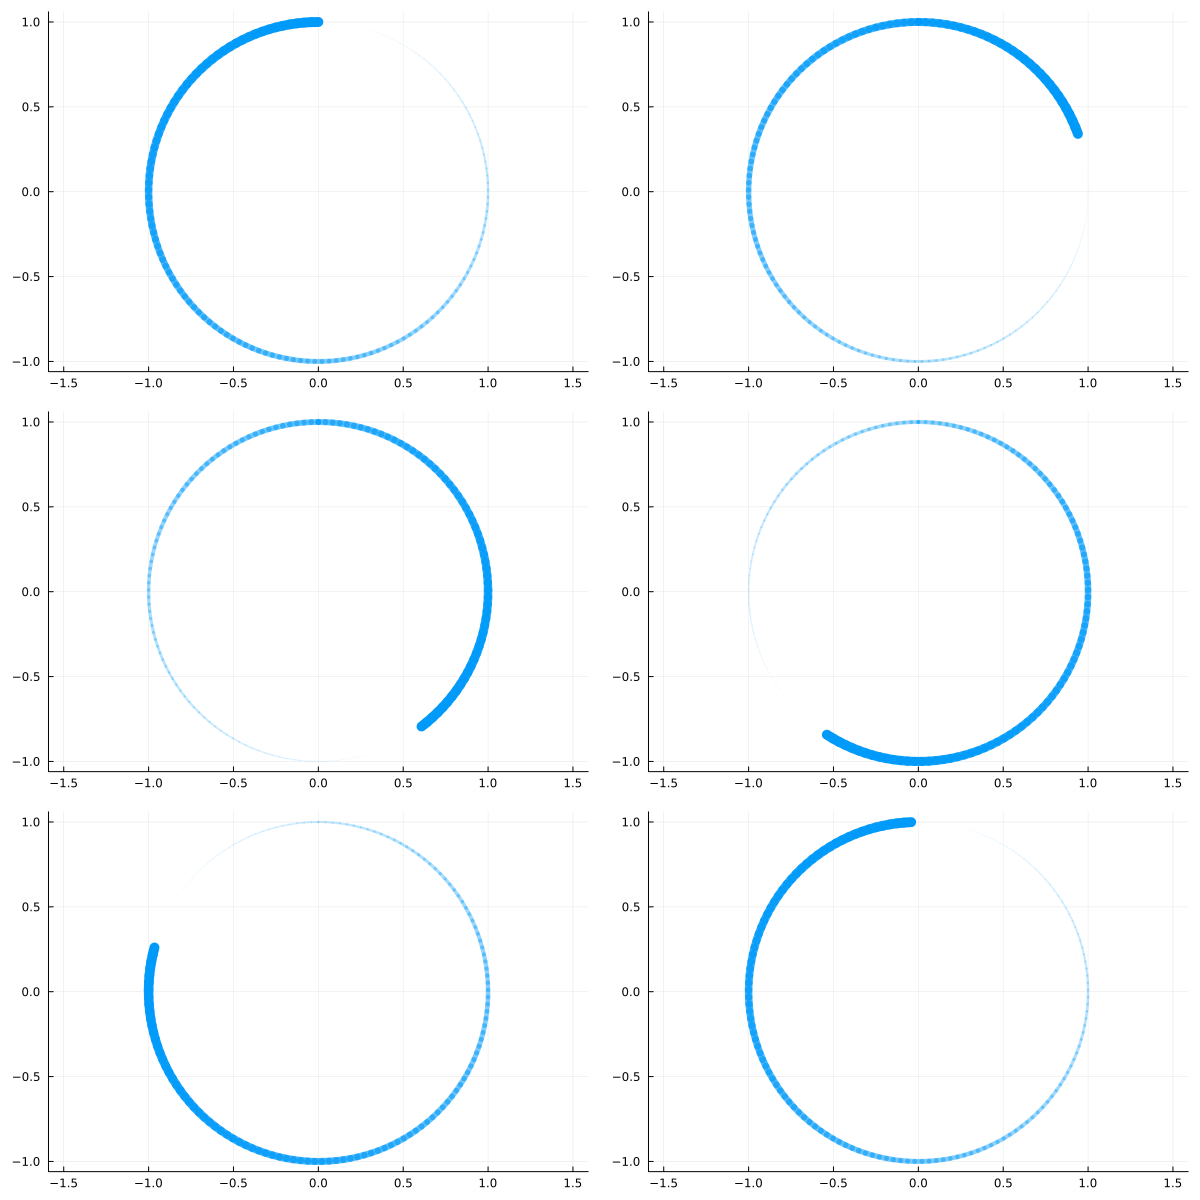
n = 150
t = range(0, 2π, length = n)
x = sin.(t)
y = cos.(t)

anim = @animate for i ∈ 1:n
    circleplot(x, y, i)
end
gif(anim, "anim_fps15.gif", fps = 15)
gif(anim, "anim_fps30.gif", fps = 30)
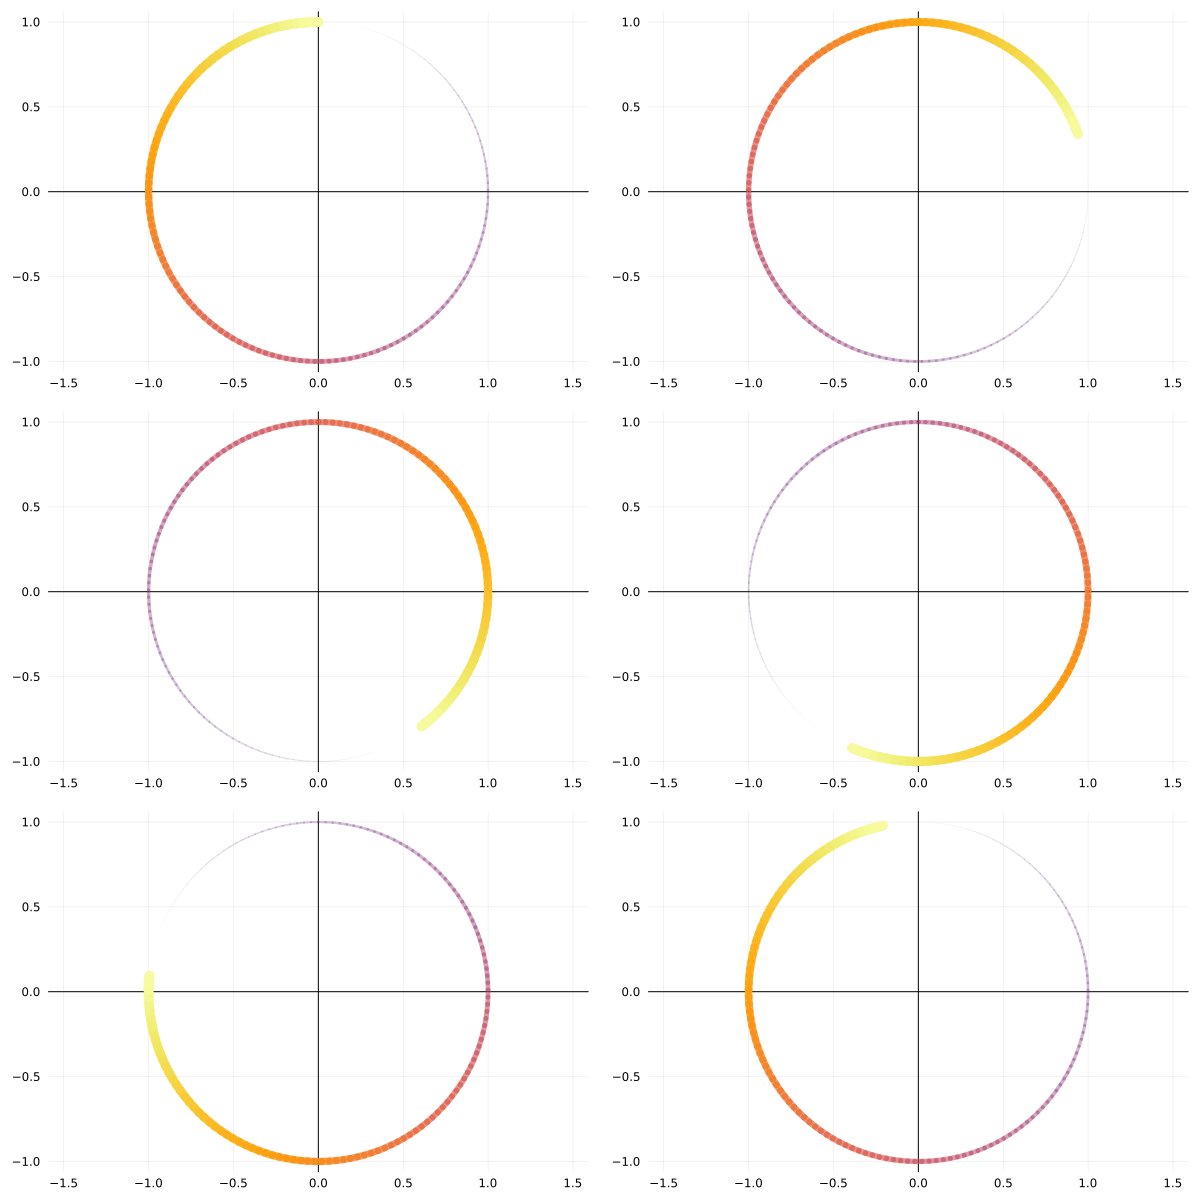
The every flag will only save a frame "every N iterations":
@gif for i ∈ 1:n
    circleplot(x, y, i, line_z = 1:n, cbar = false, framestyle = :zerolines)
end every 5
The when flag will only save a frame "when the expression is true"
n = 400
t = range(0, 2π, length = n)
x = 16sin.(t).^3
y = 13cos.(t) .- 5cos.(2t) .- 2cos.(3t) .- cos.(4t)

@gif for i ∈ 1:n
    circleplot(x, y, i, line_z = 1:n, cbar = false, c = :reds, framestyle = :none)
end when i > 40 && mod1(i, 10) == 5