Vectors of markershapes and segments
![]()

using Plots
plotlyjs()
using Base.Iterators: cycle, take
yv = ones(9)
ys = [1; 1; NaN; ones(6)]
y = 5 .- [yv 2ys 3yv 4ys]
plt_color_rows = plot(y, seriestype = [:path :path :scatter :scatter], markershape = collect(take(cycle((:utriangle, :rect)), 9)), markersize = 8, color = collect(take(cycle((:red, :black)), 9)))
plt_z_cols = plot(y, markershape = [:utriangle :x :circle :square], markersize = [5 10 10 5], marker_z = [5 4 3 2], line_z = [1 3 3 1], linewidth = [1 10 5 1])
plot(plt_color_rows, plt_z_cols)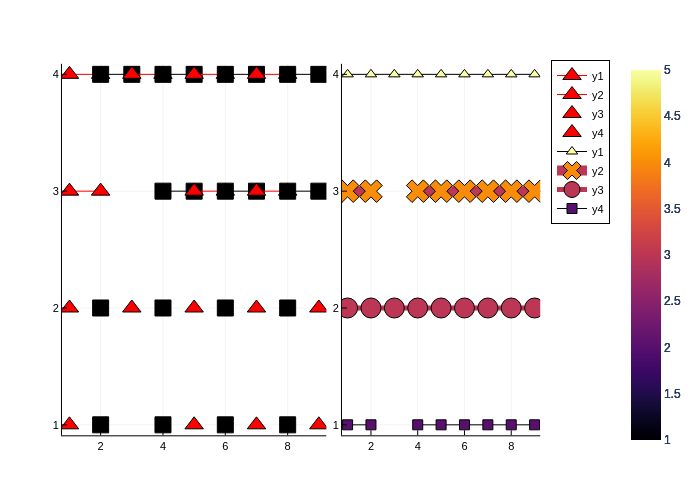
This page was generated using DemoCards.jl and Literate.jl.