Lines
![]()

using Plots
unicodeplots()
A simple line plot of the columns.
plot(Plots.fakedata(50, 5), w = 3)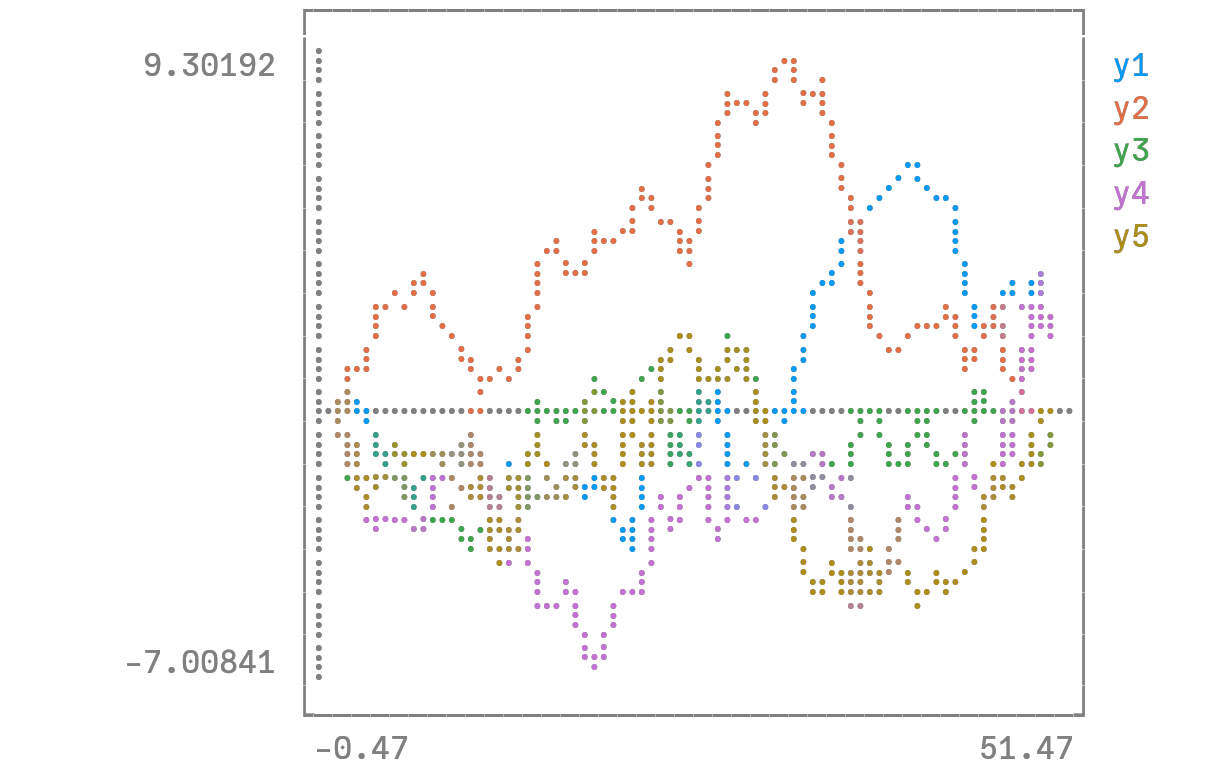
This page was generated using DemoCards.jl and Literate.jl.
![]()
using Plots
unicodeplots()A simple line plot of the columns.
plot(Plots.fakedata(50, 5), w = 3)
This page was generated using DemoCards.jl and Literate.jl.
Settings
This document was generated with Documenter.jl version 1.17.0 on Monday 16 March 2026. Using Julia version 1.12.5.