Spy
![]()

using Plots
unicodeplots()
For a matrix mat with unique nonzeros spy(mat) returns a colorless plot. If mat has various different nonzero values, a colorbar is added. The colorbar can be disabled with legend = nothing.
using SparseArrays
a = spdiagm(0 => ones(50), 1 => ones(49), -1 => ones(49), 10 => ones(40), -10 => ones(40))
b = spdiagm(0 => 1:50, 1 => 1:49, -1 => 1:49, 10 => 1:40, -10 => 1:40)
plot(spy(a), spy(b), title = ["Unique nonzeros" "Different nonzeros"])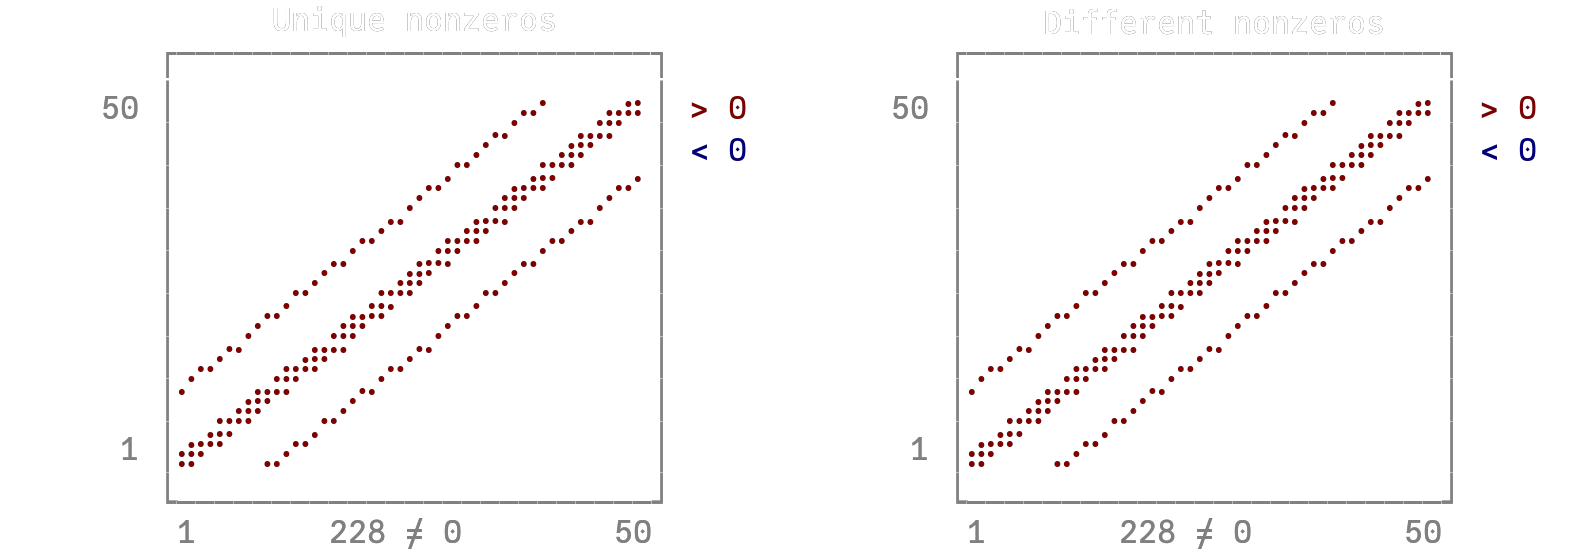
This page was generated using DemoCards.jl and Literate.jl.