Global
![]()

using Plots
plotlyjs()
Change the guides/background/limits/ticks. Convenience args xaxis and yaxis allow you to pass a tuple or value which will be mapped to the relevant args automatically. The xaxis below will be replaced with xlabel and xlims args automatically during the preprocessing step. You can also use shorthand functions: title!, xaxis!, yaxis!, xlabel!, ylabel!, xlims!, ylims!, xticks!, yticks!
using Statistics
y = rand(20, 3)
plot(y, xaxis = ("XLABEL", (-5, 30), 0:2:20, :flip), background_color = RGB(0.2, 0.2, 0.2), leg = false)
hline!(mean(y, dims = 1) + rand(1, 3), line = (4, :dash, 0.6, [:lightgreen :green :darkgreen]))
vline!([5, 10])
title!("TITLE")
yaxis!("YLABEL", :log10, minorgrid = true)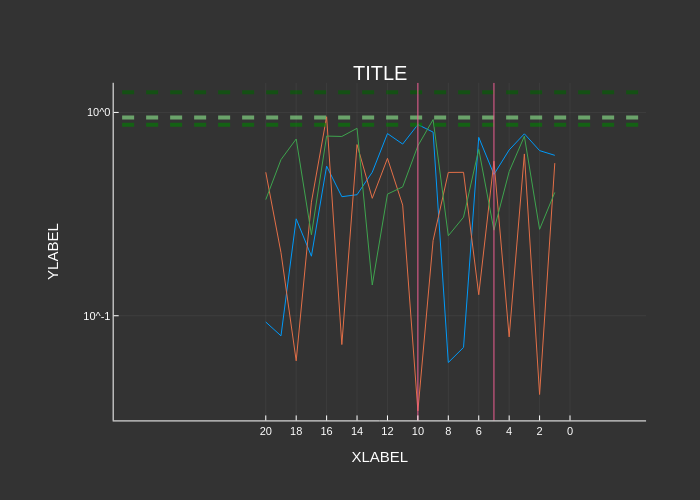
This page was generated using DemoCards.jl and Literate.jl.