Adding to subplots
![]()

using Plots
plotlyjs()
Note here the automatic grid layout, as well as the order in which new series are added to the plots.
plot(PlotsBase.fakedata(100, 10), layout = 4, palette = cgrad.([:grays :blues :heat :lightrainbow]), bg_inside = [:orange :pink :darkblue :black])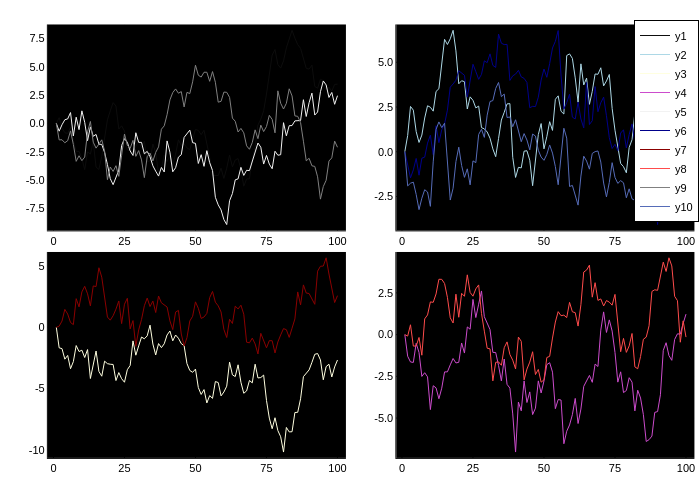
using Random
Random.seed!(111)
plot!(PlotsBase.fakedata(rng, 100, 10))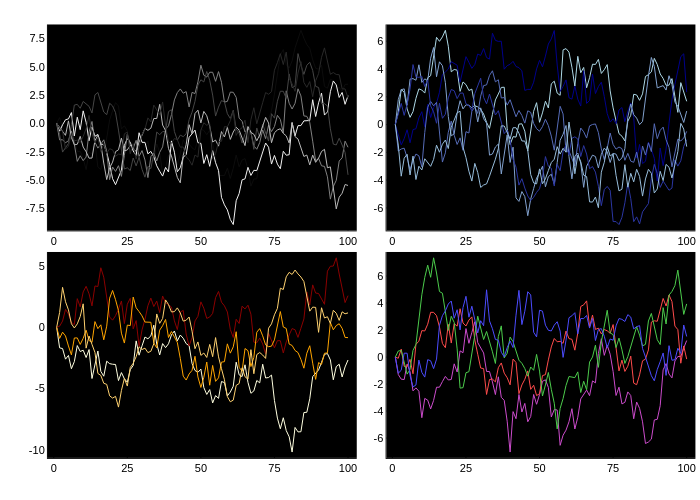
This page was generated using DemoCards.jl and Literate.jl.