Colorbar styling


using Plots
plotlyjs()
The frame drawn around a colorbar is styled with colorbar_border_color and colorbar_border_width, its tick marks with colorbar_tick_color and colorbar_tick_line_width, and its size with colorbar_width and colorbar_height, both given as a fraction of the plot area. Setting only a color is enough to request the styled element, and each attribute defaults to :auto, which keeps the backend default.
using PlotsBase.Commons
cbar_heatmap(; kw...) = begin
        heatmap(rand(10, 10); ticks = :none, margin = 0mm, kw...)
    end
plot(cbar_heatmap(title = "border color", colorbar_border_color = :red), cbar_heatmap(title = "border width", colorbar_border_width = 3), cbar_heatmap(title = "tick color", colorbar_tick_color = :red), cbar_heatmap(title = "tick width", colorbar_tick_line_width = 3), cbar_heatmap(title = "bar width", colorbar_width = 0.2), cbar_heatmap(title = "bar height", colorbar_height = 0.5), layout = (2, 3), size = (1200, 700))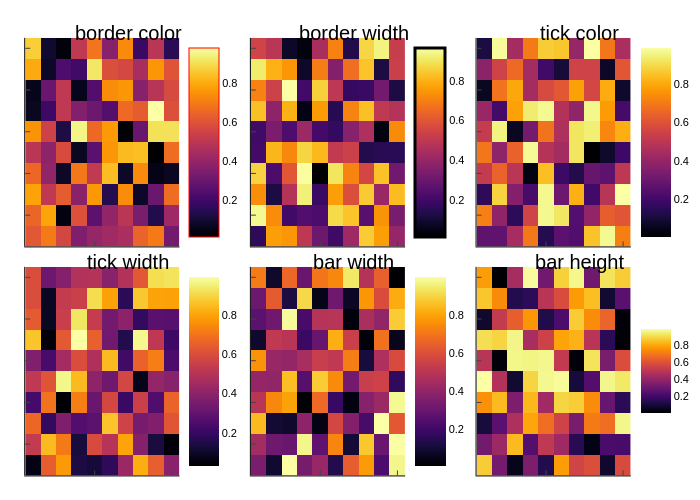
This page was generated using DemoCards.jl and Literate.jl.